We have considered using a histogram to summarise univariate data but there are other types of plot such as the box and whisker plot that can be used summarised univariate data. The box and whisker plot is a graphical method for summarising numerical data based on a five-number summary. These five numbers are the minimum, lower quartile, median, upper quartile and maximum value.
The lattice library has a function bwplot that can be used to create a box and whisker plot for a some data and using the standard mechanism individual plots can be produced for different factors levels to divide up the data into meaningful groups.
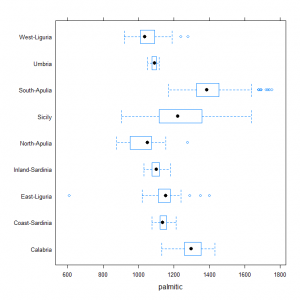
As an example we can use the olive oil data to produce a box and whisker summary of the palmitic variable for each of the areas in the data:
library(lattice) bwplot(Area ~ palmitic, data = olive.df) |
The first argument is a formula to describe the variables to include in the plot and because Area is a factor the function interprets this to mean that we want a separate summary for each of the levels of this factor. The graph produced looks like this:
This type of plot can also be useful when exploring residuals from a fitted model.

