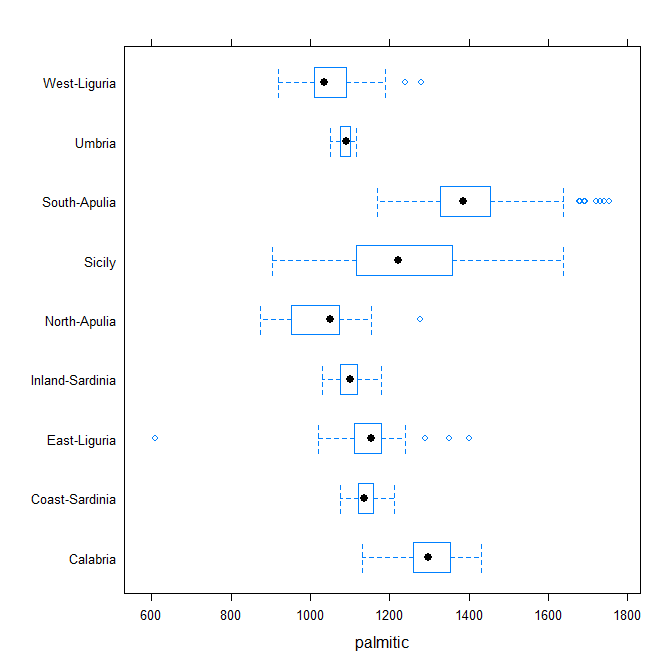
An example of using the bwplot function to summarise the palmitic variable based on the different areas covered by the data set.
An example of using the bwplot function to summarise the palmitic variable based on the different areas covered by the data set.

There are the following book reviews on this website:
Book Review – Modern Applied Statistics with S by W. N. Venables and B. D. Ripley (Springer 2003)
Book Review – ggplot 2: Elegant Graphics for Data Analysis by Hadley Wickham (Springer 2009)
Book Review – Lattice: Multivariate Data Visualization with R by Deepayan Sarkar (Springer 2008)