The term Exploratory Data Analysis (EDA) refers to an approach to data analysis where no prior assumptions are made about model structure and is characterised by its use of graphical displays to investigate potential patterns of interest to the analyst. These ideas were initially formulated and proposed by John Tukey and other researchers who believed that the role and importance of statistical hypothesis testing was too dominant and that further insight a set of data could be discovered by allowing the data itself to reveal its underlying structure and model. The rises of statistical software systems such as R or GGobi have provided investigators with the tools to easily undertake these types of exploratory analysis.
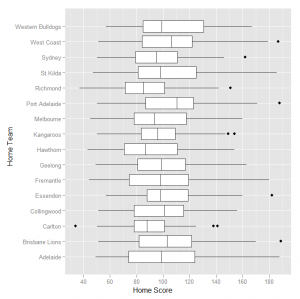
As an example of exploratory data analysis consider data from the AFL on total points scored by the home team in the various fixtures. A boxplot would provide an initial indication of the consistency of the total score for the different teams in the competition.
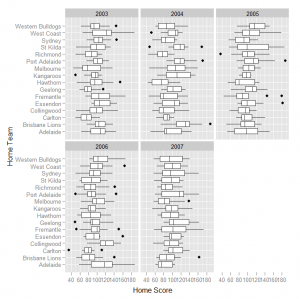
We can divide the data into different seasons so that there are five separate plots on the page, each with the same scales so that comparisons can be made between the teams in each season.
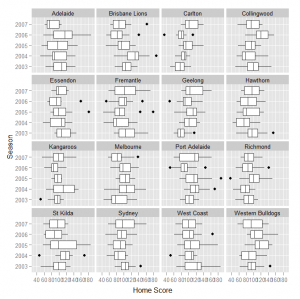
Alternatively we could use a separate panel for each of the teams to directly compared their points scored in home fixtures across the five seasons.
Other useful resources are provided on the Supplementary Material page.


