The relationship between two variables can be visually represented using a scatter plot and will provide some insight into the correlation between the variables and possible models to describe the relationship. There are different ways to produce scatter plots in R making use of either the base graphics system, the lattice graphics library, ggplot2 or other packages.
The R system has various data sets available for analysis, for example the Puromycin data which describes an experiment to study the relationship between reaction velocity and substrate concentration in an enzymatic reaction involving untreated cells or cells that were treated with Puromycin.
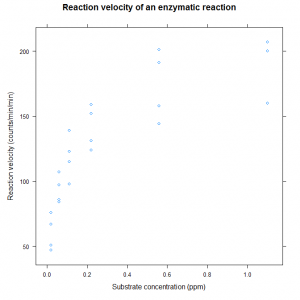
The variable rate can be plotted against the variable conc to investigate the relationship. Using the lattice package we can use the xyplot function to create a graph with the following code:
xyplot(rate ~ conc, data = Puromycin, xlab = "Substrate concentration (ppm)", ylab = "Reaction velocity (counts/min/min)", main = "Reaction velocity of an enzymatic reaction") |
In this graph we do not distinguish between the untreated and treated cells and this code produces this graph:
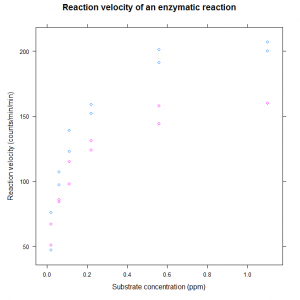
We can make use of different plotting symbols to distinguish between the treated and untreated cells by the groups argument. We adjust the above code as follows:
xyplot(rate ~ conc, data = Puromycin, xlab = "Substrate concentration (ppm)", ylab = "Reaction velocity (counts/min/min)", main = "Reaction velocity of an enzymatic reaction", groups = state) |
Here the graph is now:
An alternative would make use of the panelling facilities in lattice graphics to plot the data for the treated and untreated cells separately.


