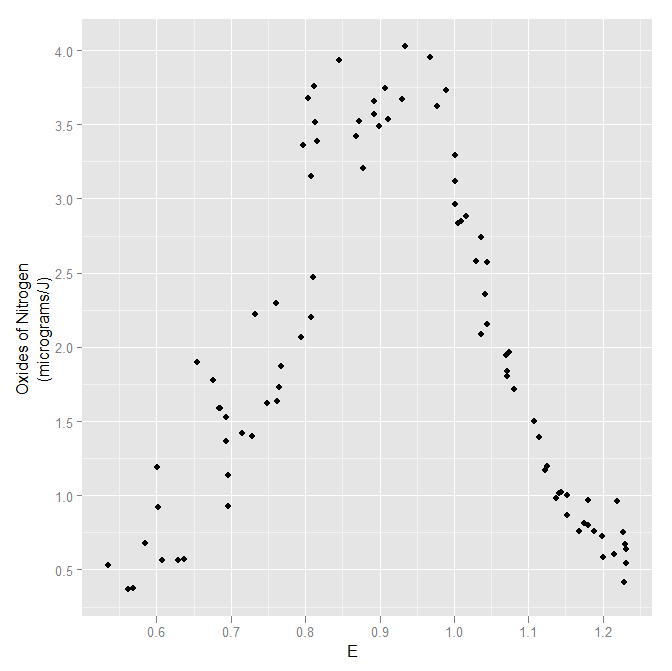
Example 1-4 from the Visualizing Data book.
Example 1-4 from the Visualizing Data book.

There are the following book reviews on this website:
Book Review – Modern Applied Statistics with S by W. N. Venables and B. D. Ripley (Springer 2003)
Book Review – ggplot 2: Elegant Graphics for Data Analysis by Hadley Wickham (Springer 2009)
Book Review – Lattice: Multivariate Data Visualization with R by Deepayan Sarkar (Springer 2008)